
Key takeaways
- Our toxicity model covers 42 ADMET and toxicity endpoints in a single suite: from Tox21 through CYP450 to ecotoxicology.
- Mean classification AUC on the hard scaffold holdout: 0.860; 19 endpoints reach AUC ≥ 0.85.
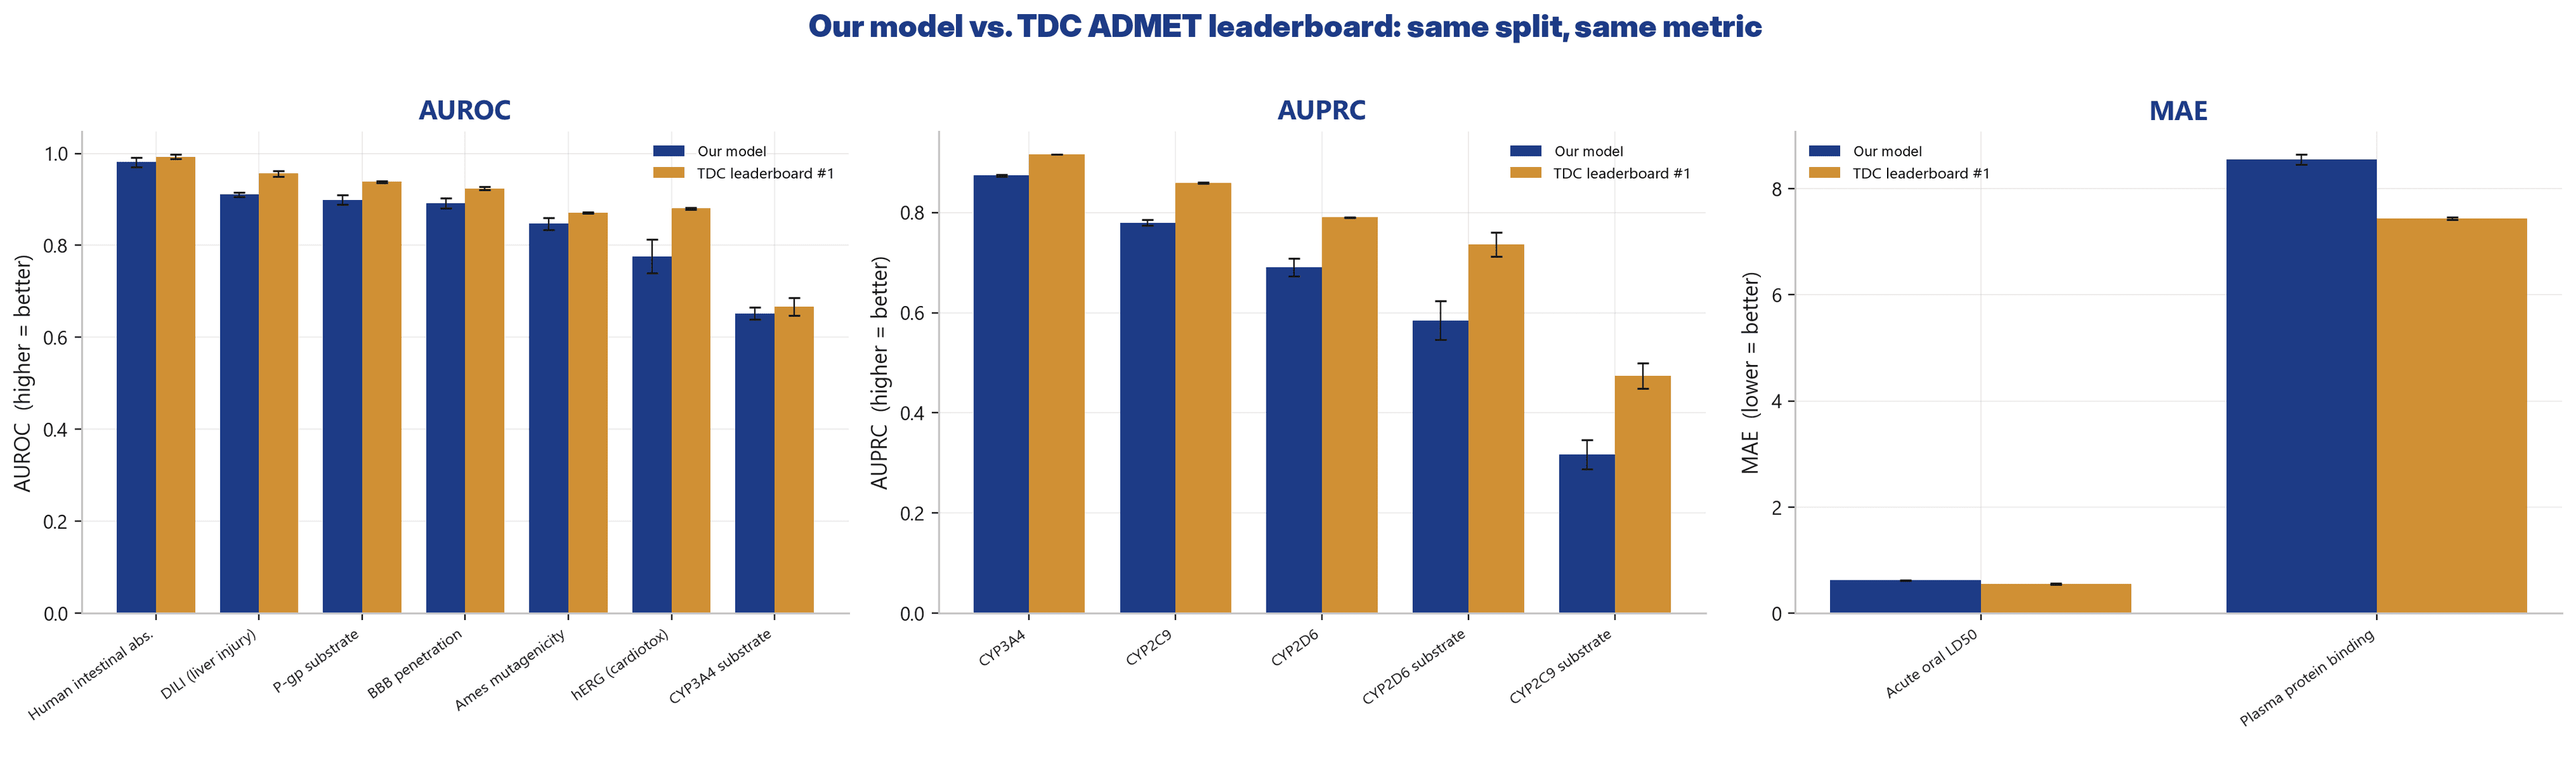
- We ran a true same-split, same-metric head-to-head against the TDC ADMET leaderboard: retrained on TDC's official split, scored by TDC's own evaluator.
- The honest result: on the AUROC endpoints, our toxicity model sits on average a few points below the best dataset-specialized model, with one standard pipeline across all endpoints.
- We name the weak spots openly (substrate endpoints, PPBR) instead of hiding them.
The question behind the benchmark
Toxicity and ADMET properties decide early on whether a drug candidate succeeds or fails. Mutagenicity, hERG cardiotoxicity, liver injury, CYP450 interactions: recognizing these risks late burns years and budget. The obvious hope: can a model predict these properties before you walk into the lab?
The honest answer: partially, very well on some endpoints and not yet well enough on others. That nuanced answer is what we deliver here, with the numbers laid out openly instead of a marketing promise.
What our toxicity model covers
The first value of our toxicity model is not a single top number, but breadth: 42 ADMET and toxicity endpoints in one suite with a single, unified entry point.
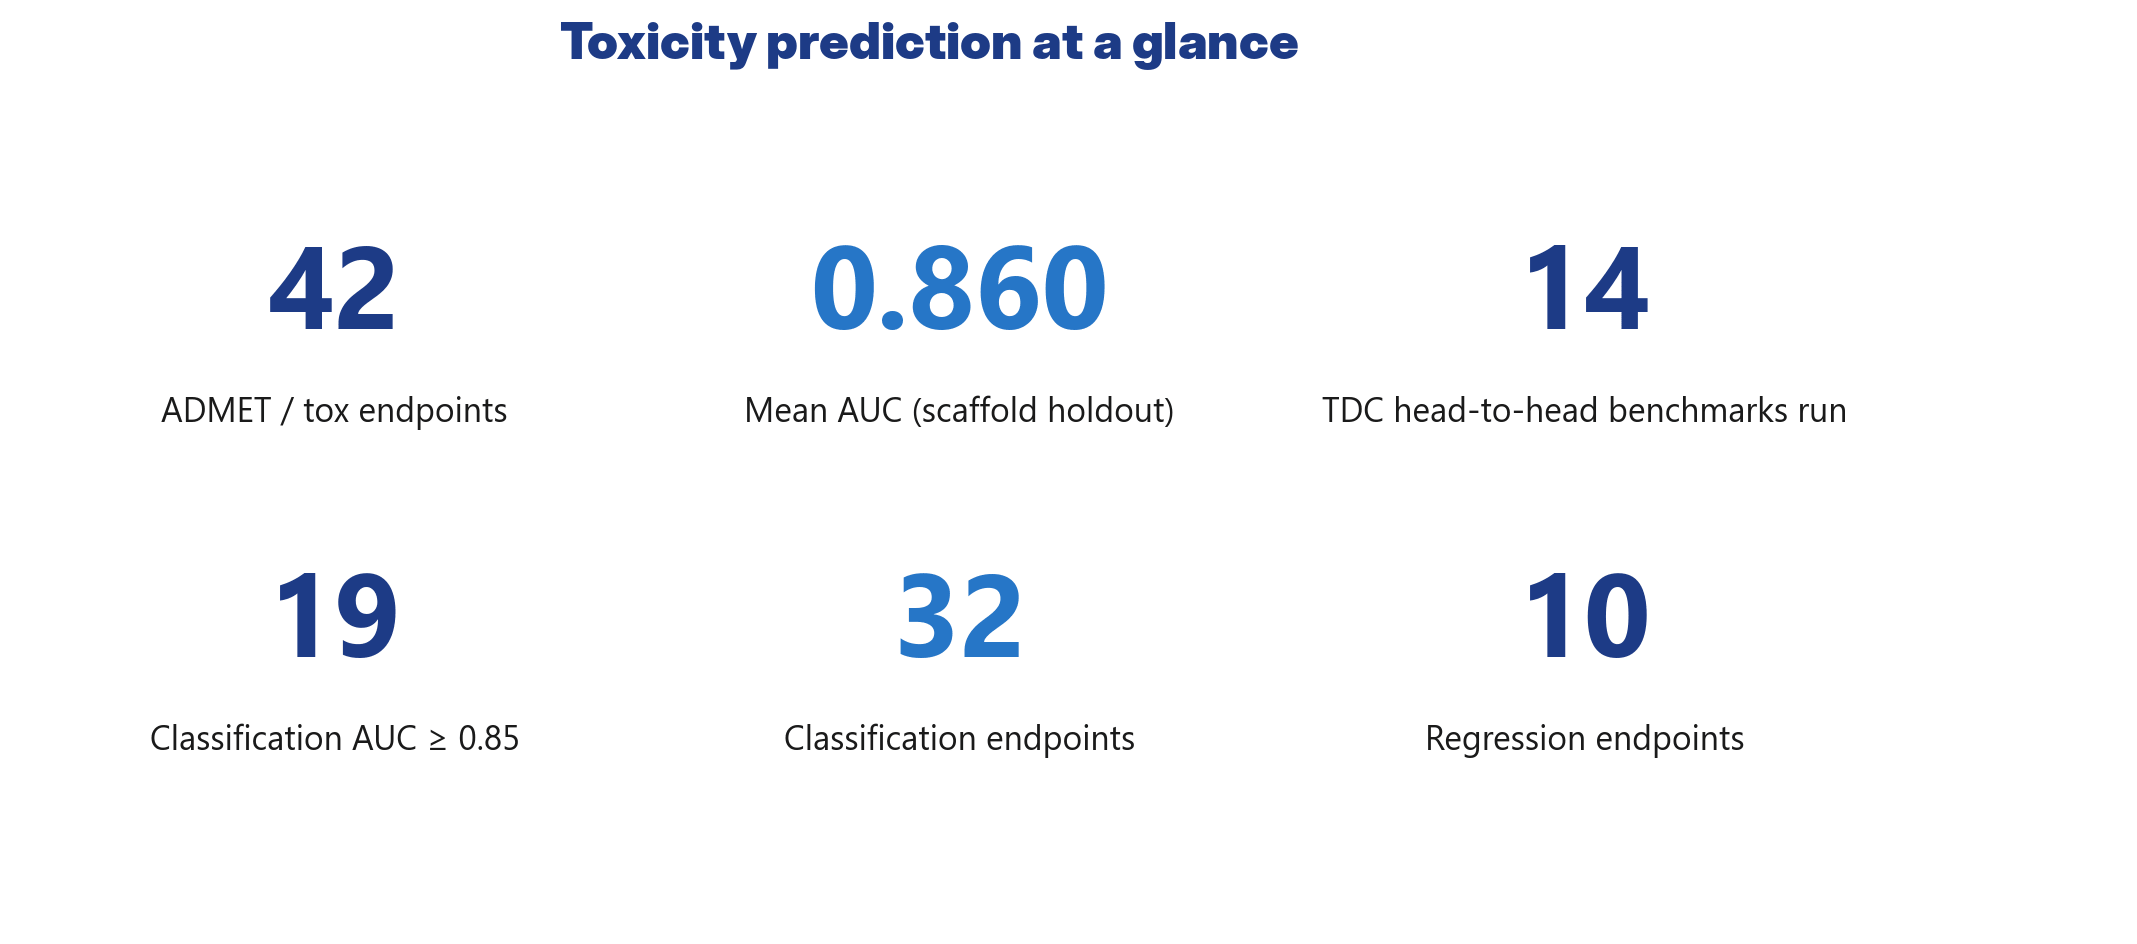
Concretely that is 32 classification and 10 regression endpoints, grouped into domain families: the full Tox21 panel (12 nuclear-receptor and stress-response targets), the CYP450 panel (five inhibition isoforms plus substrate prediction), classical ADME endpoints (intestinal absorption, BBB, P-gp, PAMPA), organ toxicity (DILI, hERG), and ecotoxicology. The mean classification AUC on the scaffold holdout sits at 0.860, and 19 endpoints reach an AUC of 0.85 or higher.
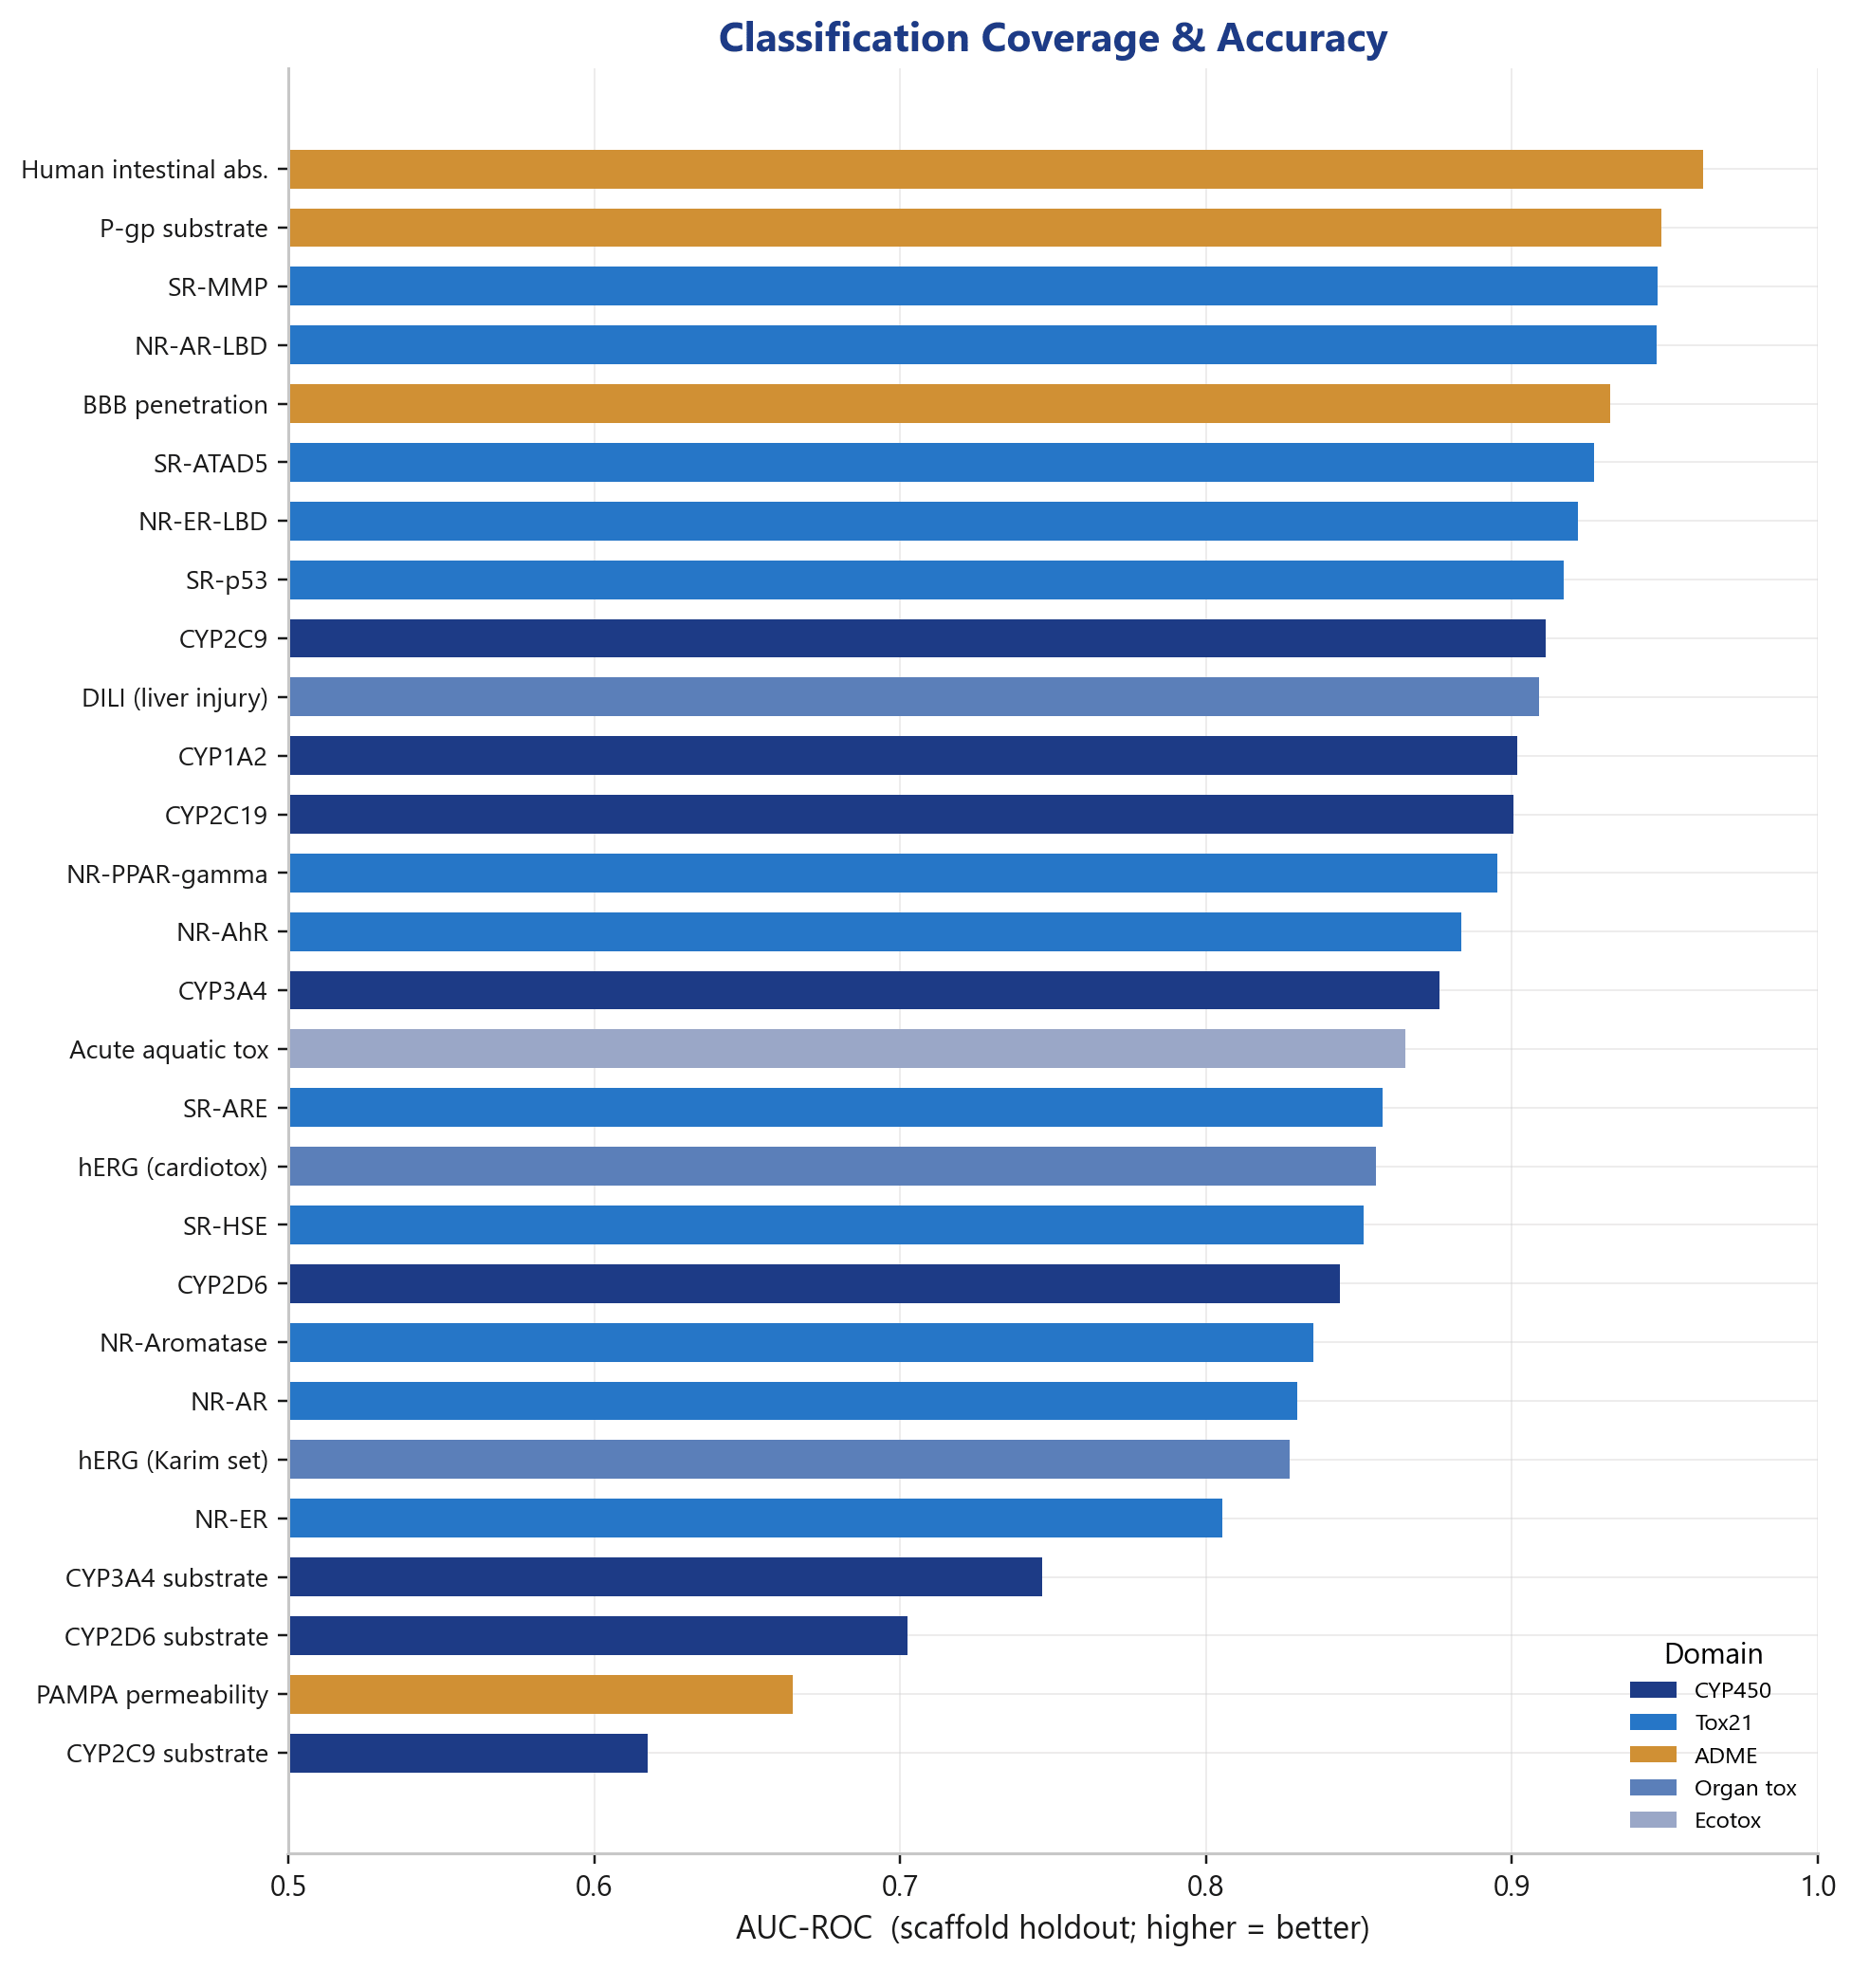
For a safety profile, this breadth is the actual lever: a single integration covers what otherwise takes a dozen separately maintained models.
The honest part: scaffold holdout, not random split
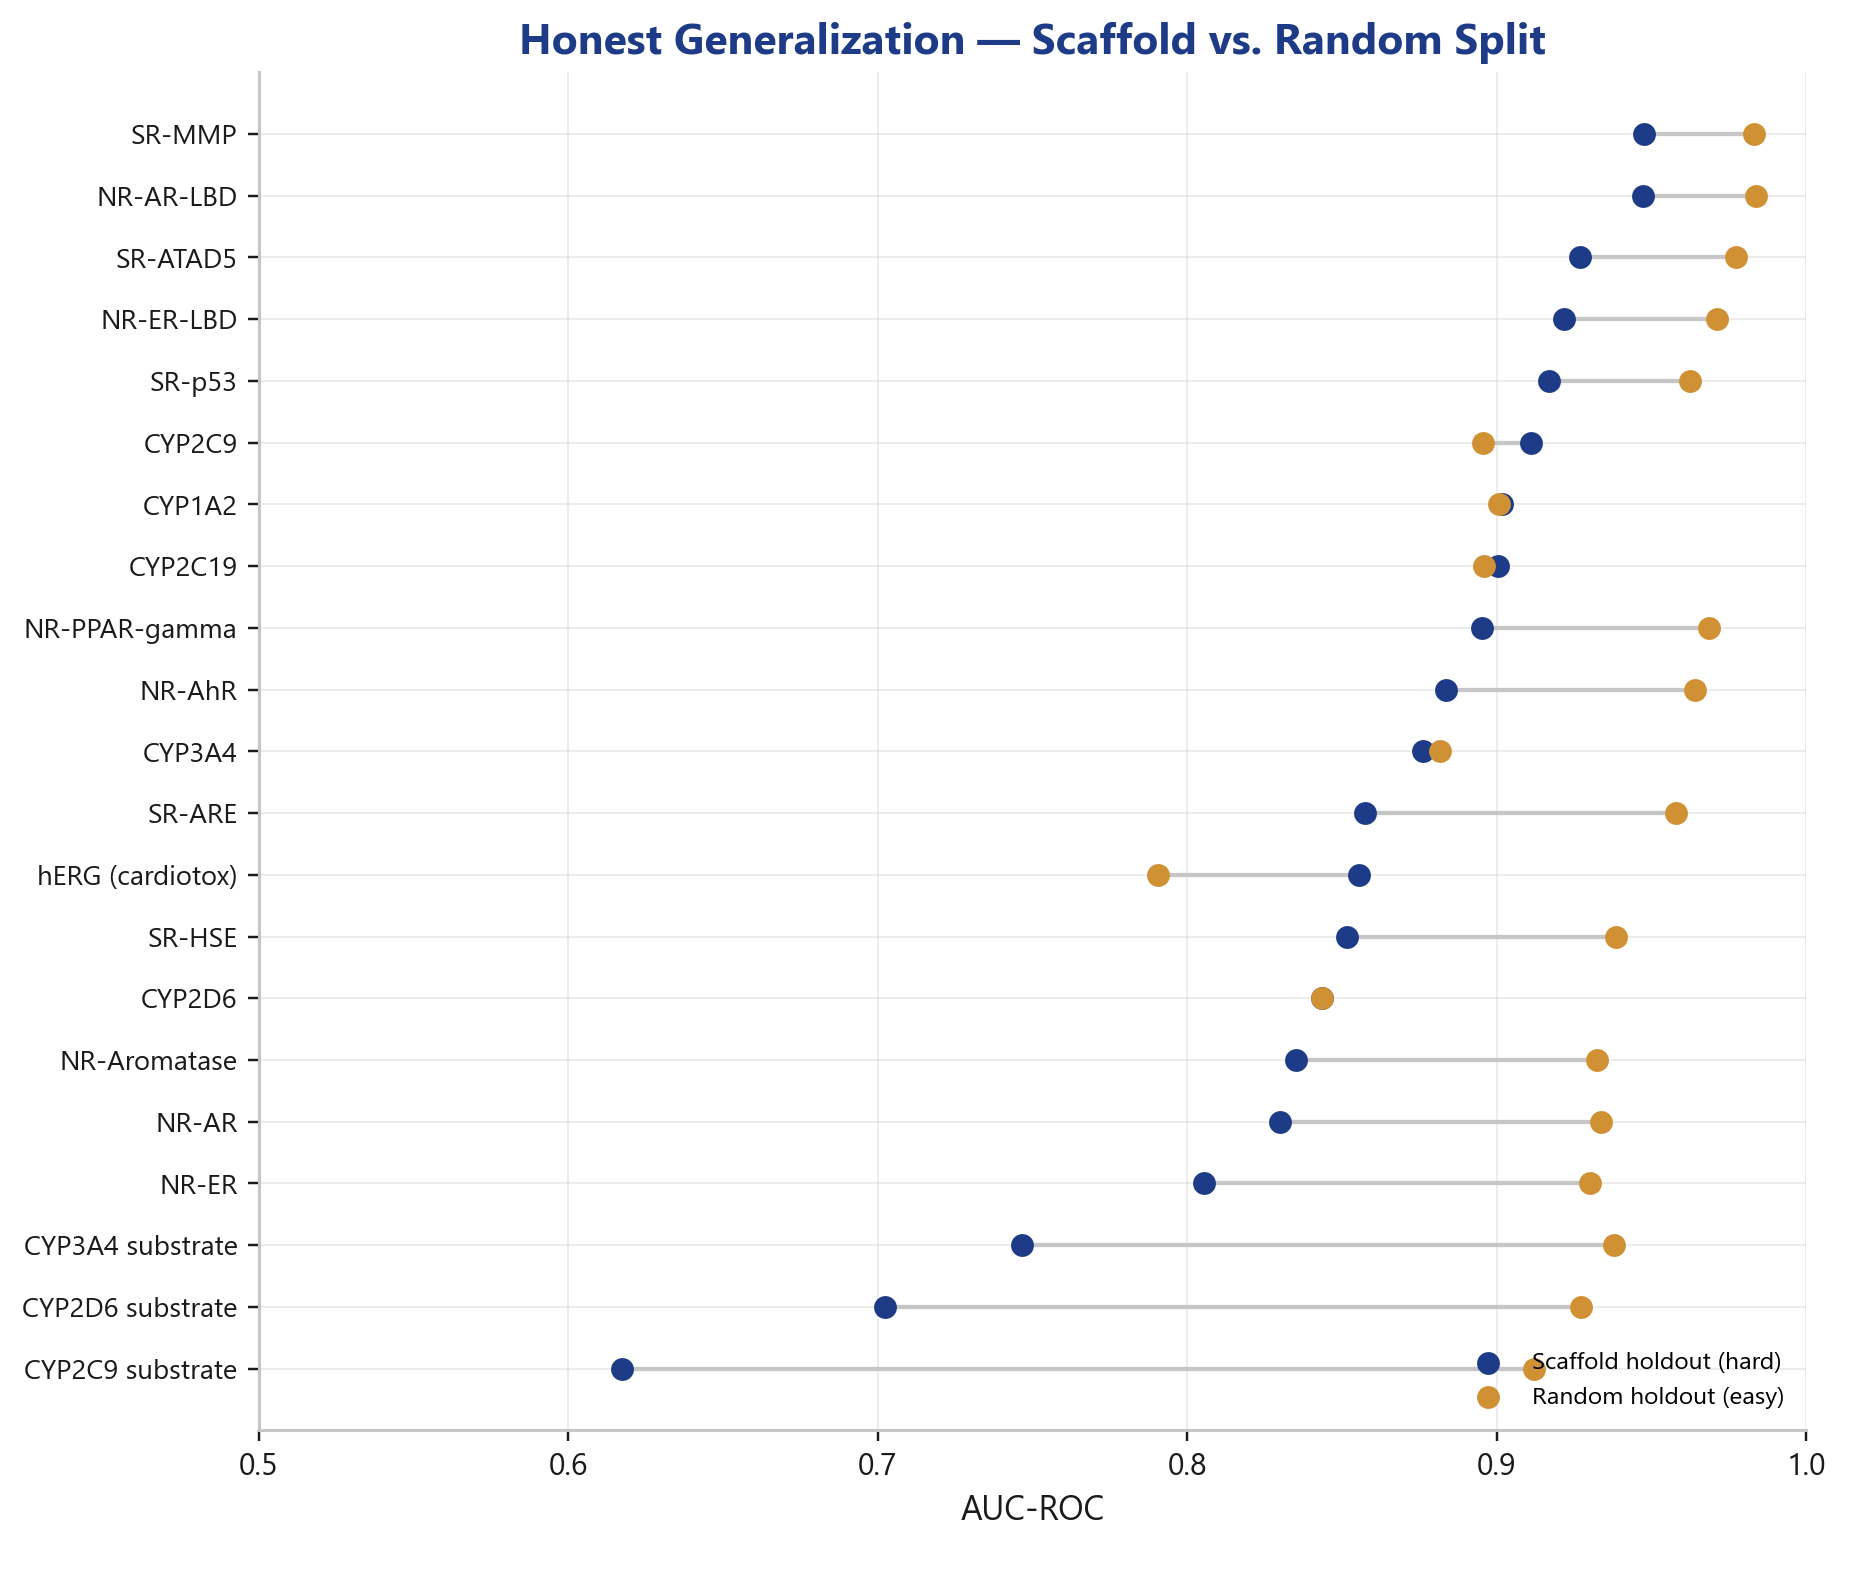
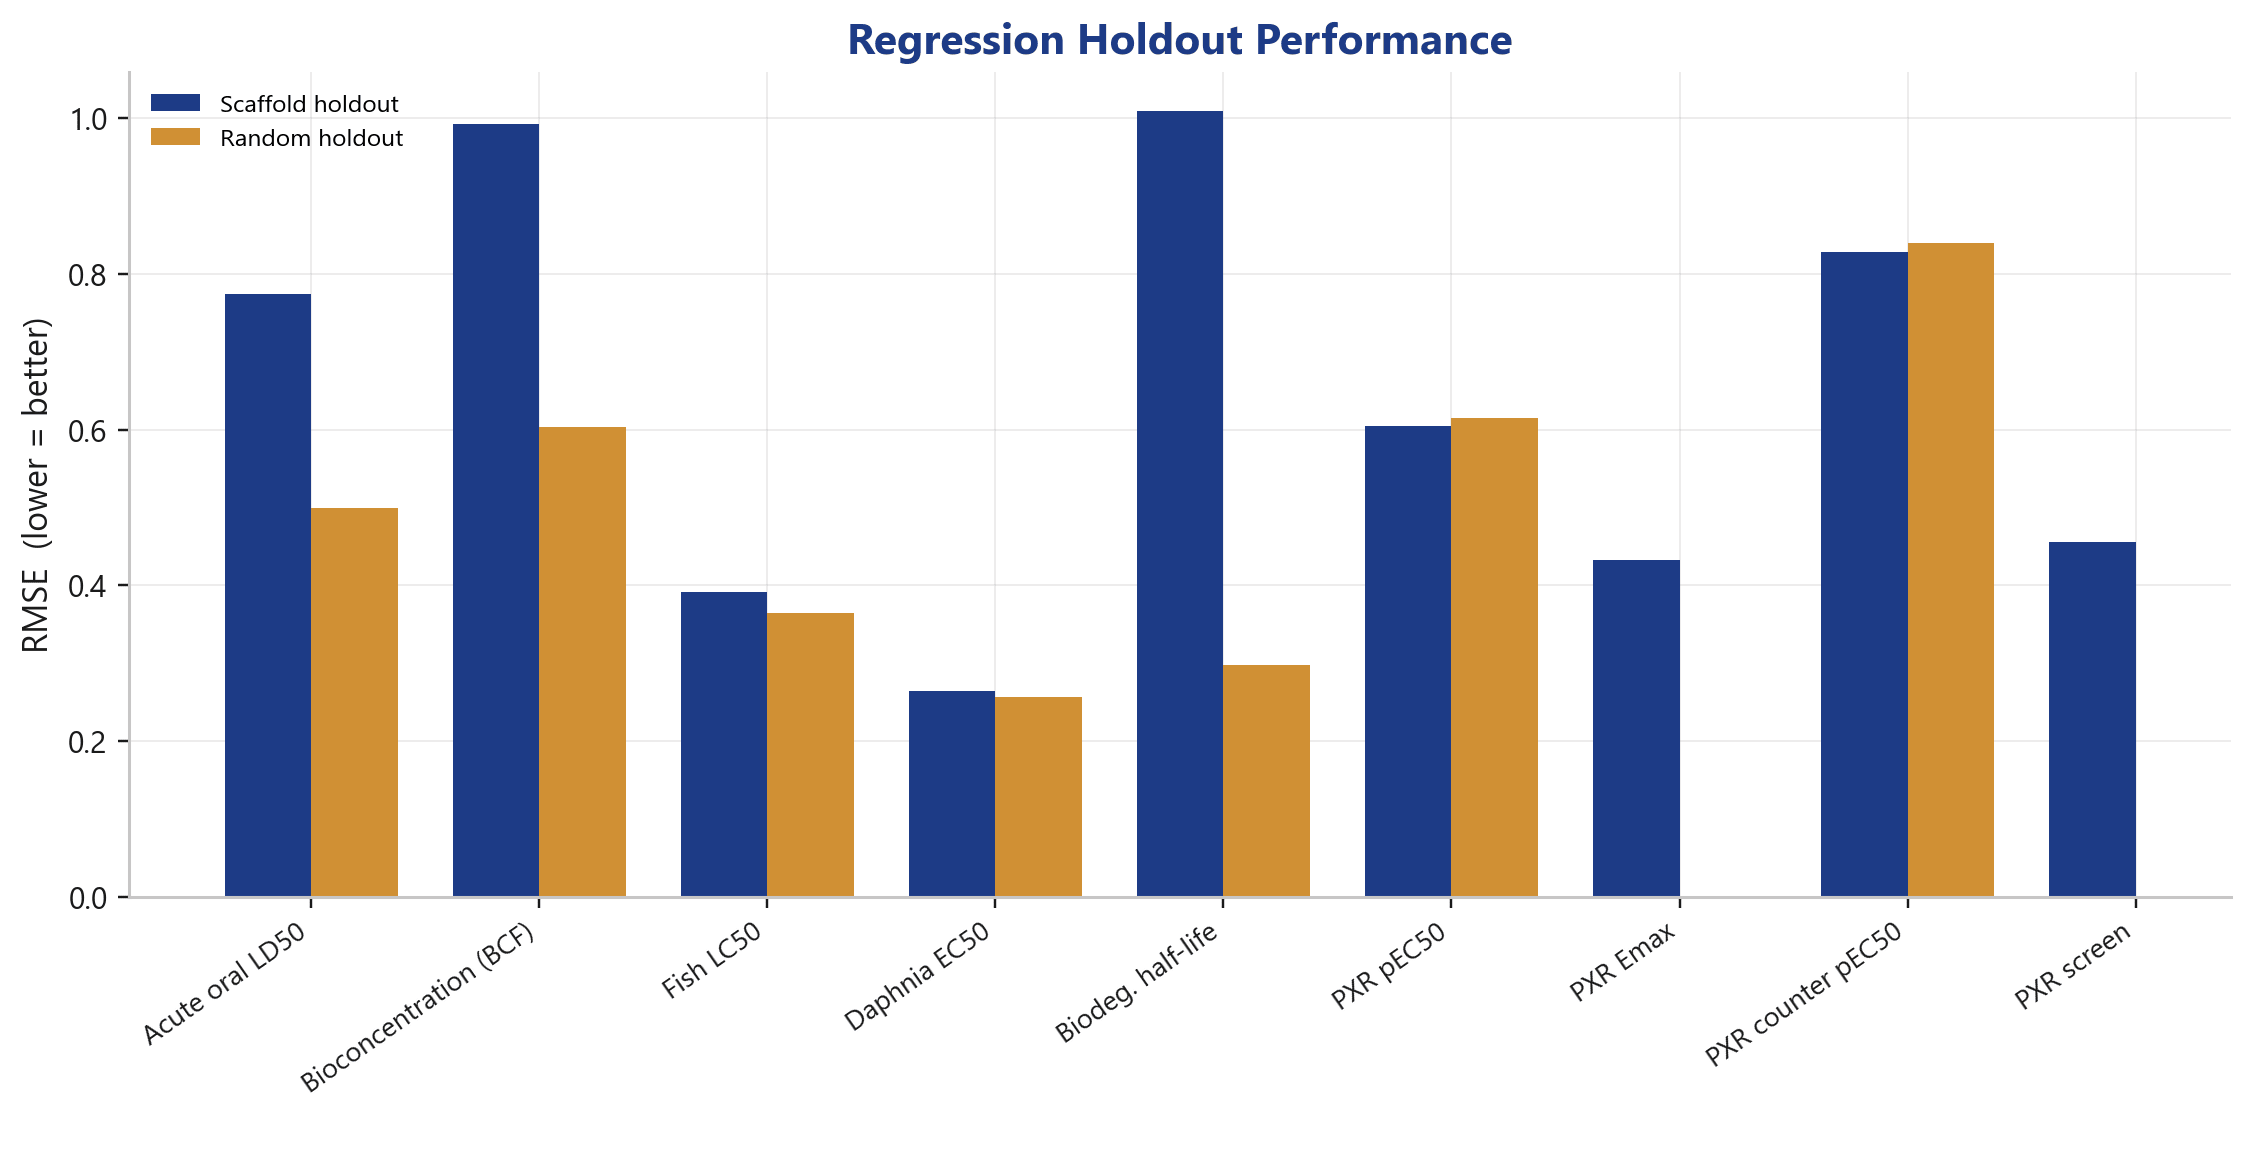
As with our solubility model, we report the hard number. With a random split, structurally similar molecules land in training and test: the model sees old friends at evaluation time, and the numbers look better than they hold up in real research. With a scaffold holdout, entire molecular cores are held back; the model has to generalize to new structural classes.
The gap between the two is real and visible for every endpoint: for most, the random value sits above the scaffold value; for some (e.g. CYP2D6 substrate, CYP3A4 substrate) the gap is substantial. We report the scaffold value as the headline: the honest measure of how the model behaves on new chemistry. A vendor showing only random-split numbers is measuring an easier task.
The actual litmus test: a true comparison
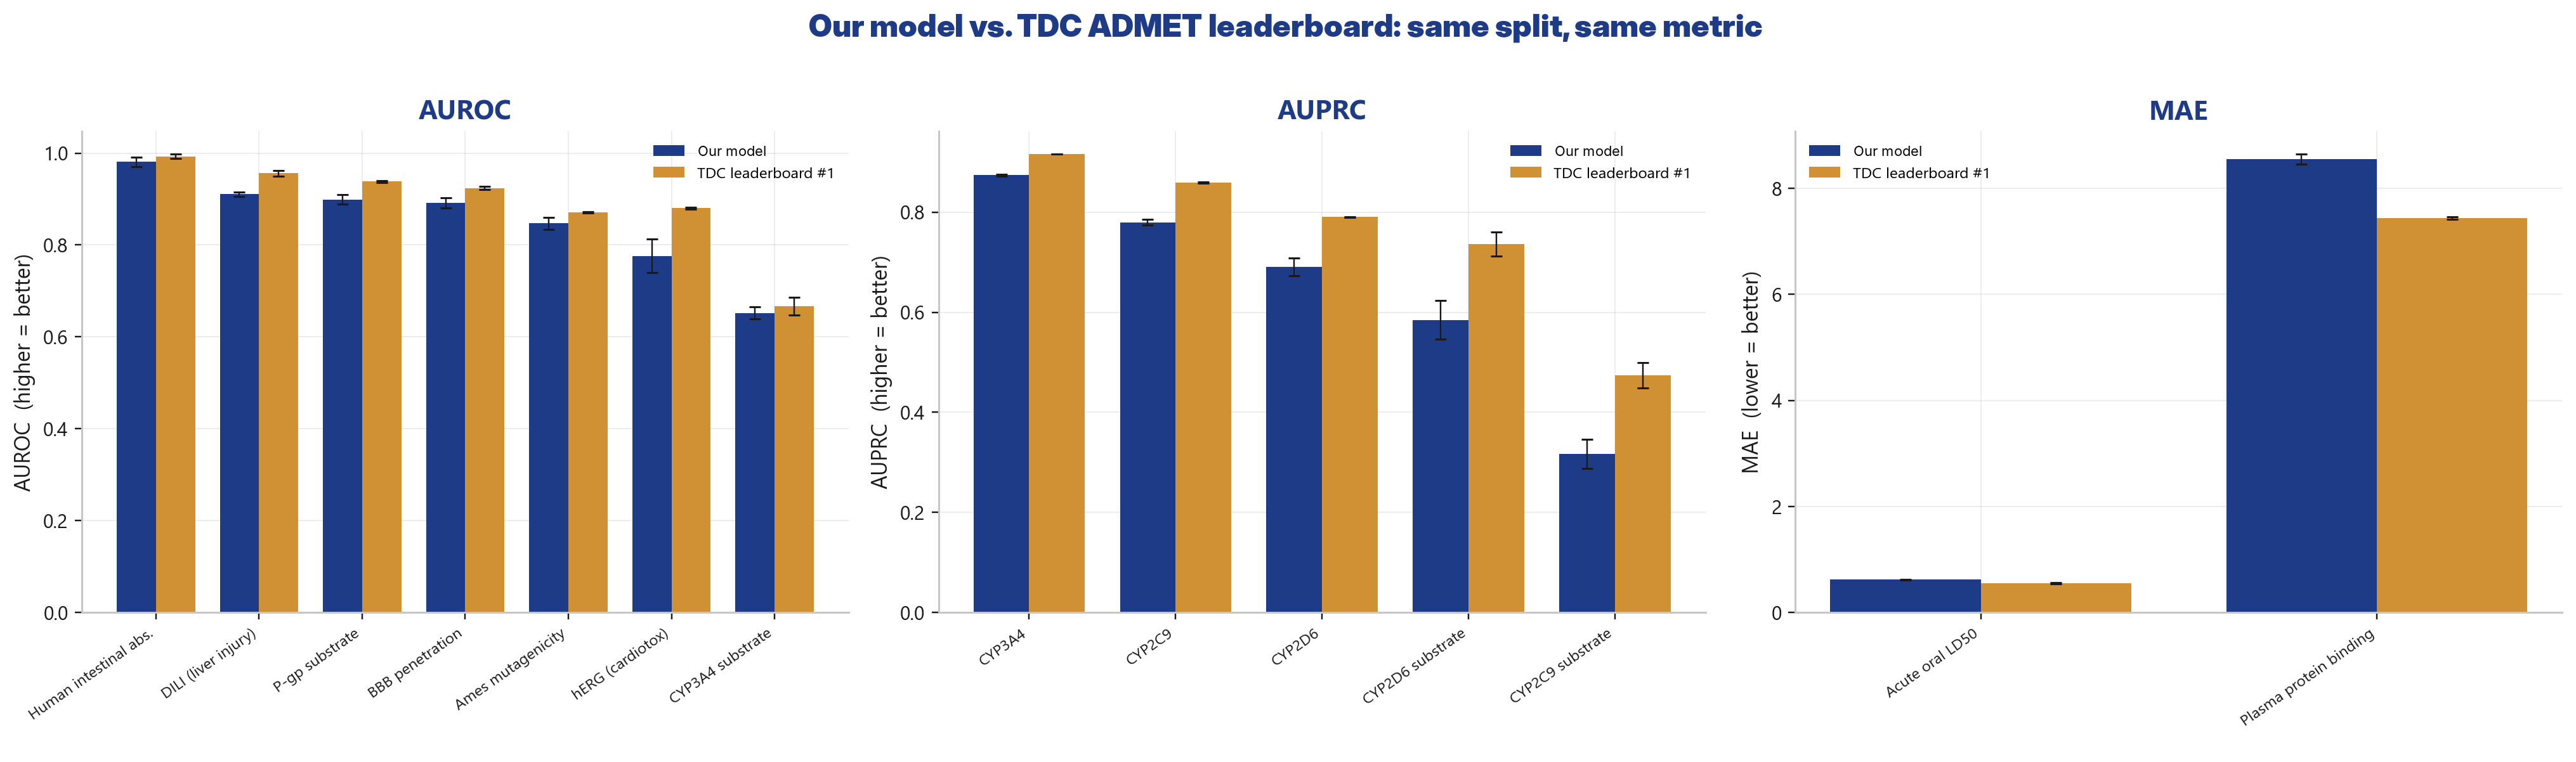
Most "SOTA" claims in tox prediction are unverifiable because they run on different datasets and splits. We wanted a comparison that holds up to a reviewer, and therefore did the opposite: a true same-split, same-metric head-to-head against the TDC ADMET Benchmark Group leaderboard.
The methodology is deliberately strict:
- Same split. For the 14 ADMET datasets that map to an endpoint of our prediction, we use TDC's official train/test split.
- No leakage. Our toxicity model is retrained from scratch on the official training split only (5 seeds): not the deployed model, whose training data would overlap the TDC test set.
- Same metric. Scored by TDC's own evaluator, which applies each dataset's official metric (AUROC, AUPRC, or MAE).
- Citable reference. The comparison bar is the current #1 leaderboard entry per dataset.
And now the result: unvarnished.
What the comparison shows
On the AUROC endpoints, the classical tox/ADMET classifications, our toxicity model is competitive but not yet leading. On average it sits roughly four AUROC points below the best model. For some endpoints the gap is small:
- Intestinal absorption (HIA): our model 0.981 vs. TDC #1 0.993 (MiniMol)
- Liver injury (DILI): our model 0.911 vs. TDC #1 0.956 (MiniMol)
- Ames mutagenicity: our model 0.847 vs. TDC #1 0.871 (ZairaChem)
- CYP3A4 substrate: our model 0.652 vs. TDC #1 0.667 (CFA)
For others it is larger: hERG (0.776 vs. 0.880, MapLight+GNN) is the clearest gap and a clear improvement target. On the AUPRC substrate endpoints (CYP2C9 / CYP2D6 substrate) and on plasma protein binding (PPBR, MAE) our toxicity model lags noticeably.
The decisive context: leaderboard winners are usually models optimized for exactly that one dataset; different methods win different datasets (MiniMol, MapLight+GNN, ZairaChem, ContextPred). Our toxicity prediction achieves its numbers with one consistent method across all 42 endpoints, in use on real lab questions. That is a different trade-off: not the peak value on one dataset, but reliable breadth in a deployable system.
The panels in detail
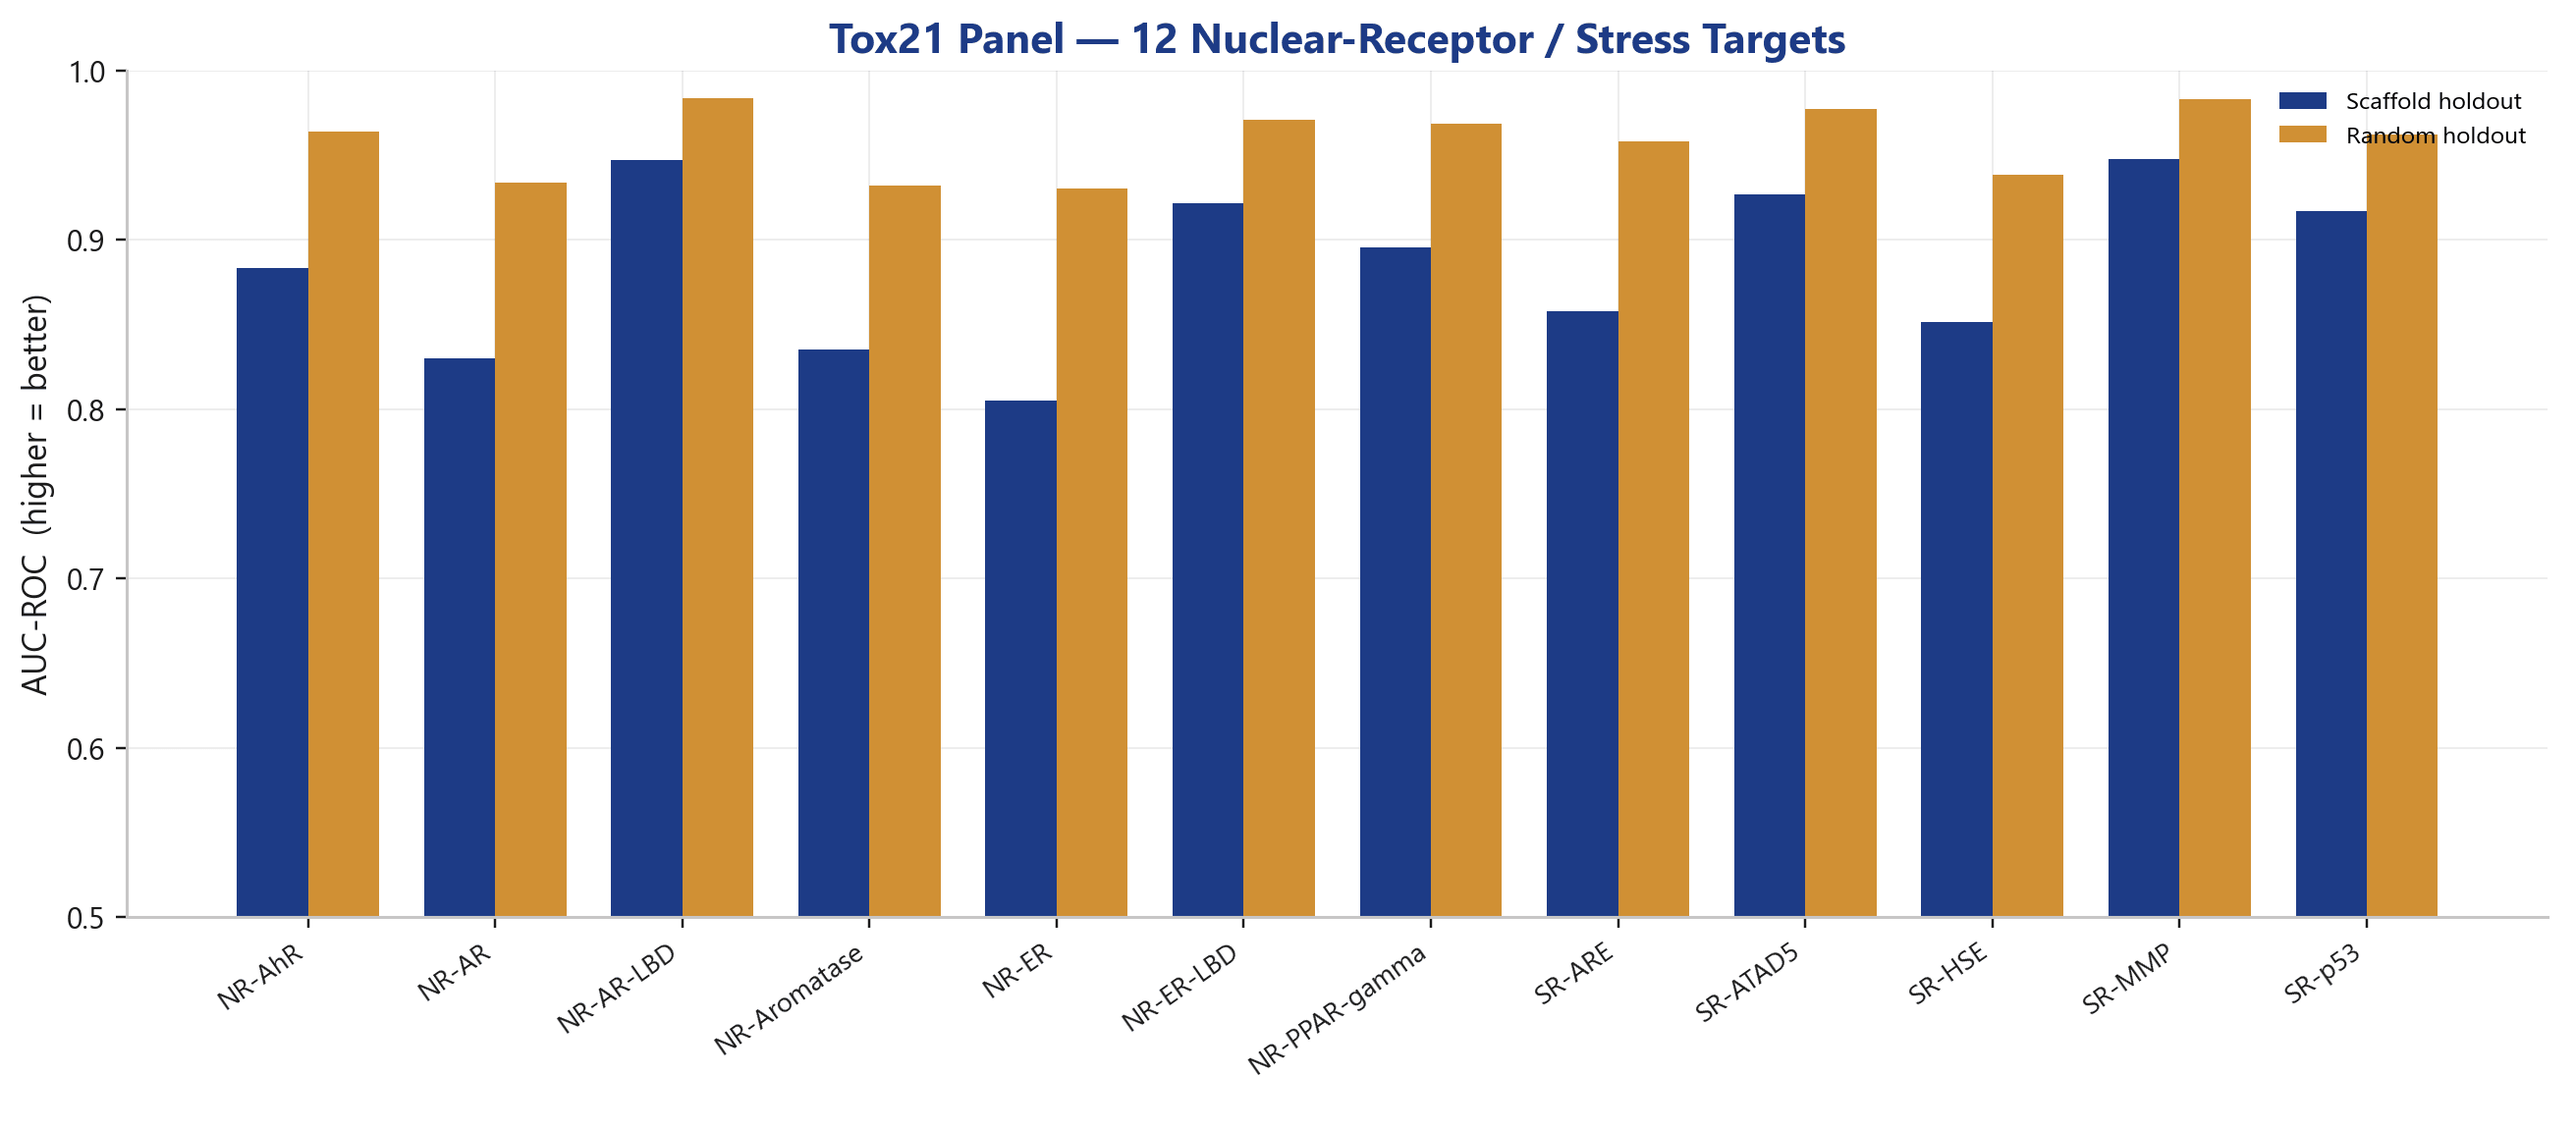
The Tox21 panel is trained as a shared multi-task cluster and sits consistently in the solid range: several targets (SR-MMP 0.948, NR-AR-LBD 0.947, SR-p53 0.917) above 0.9 on the scaffold split.
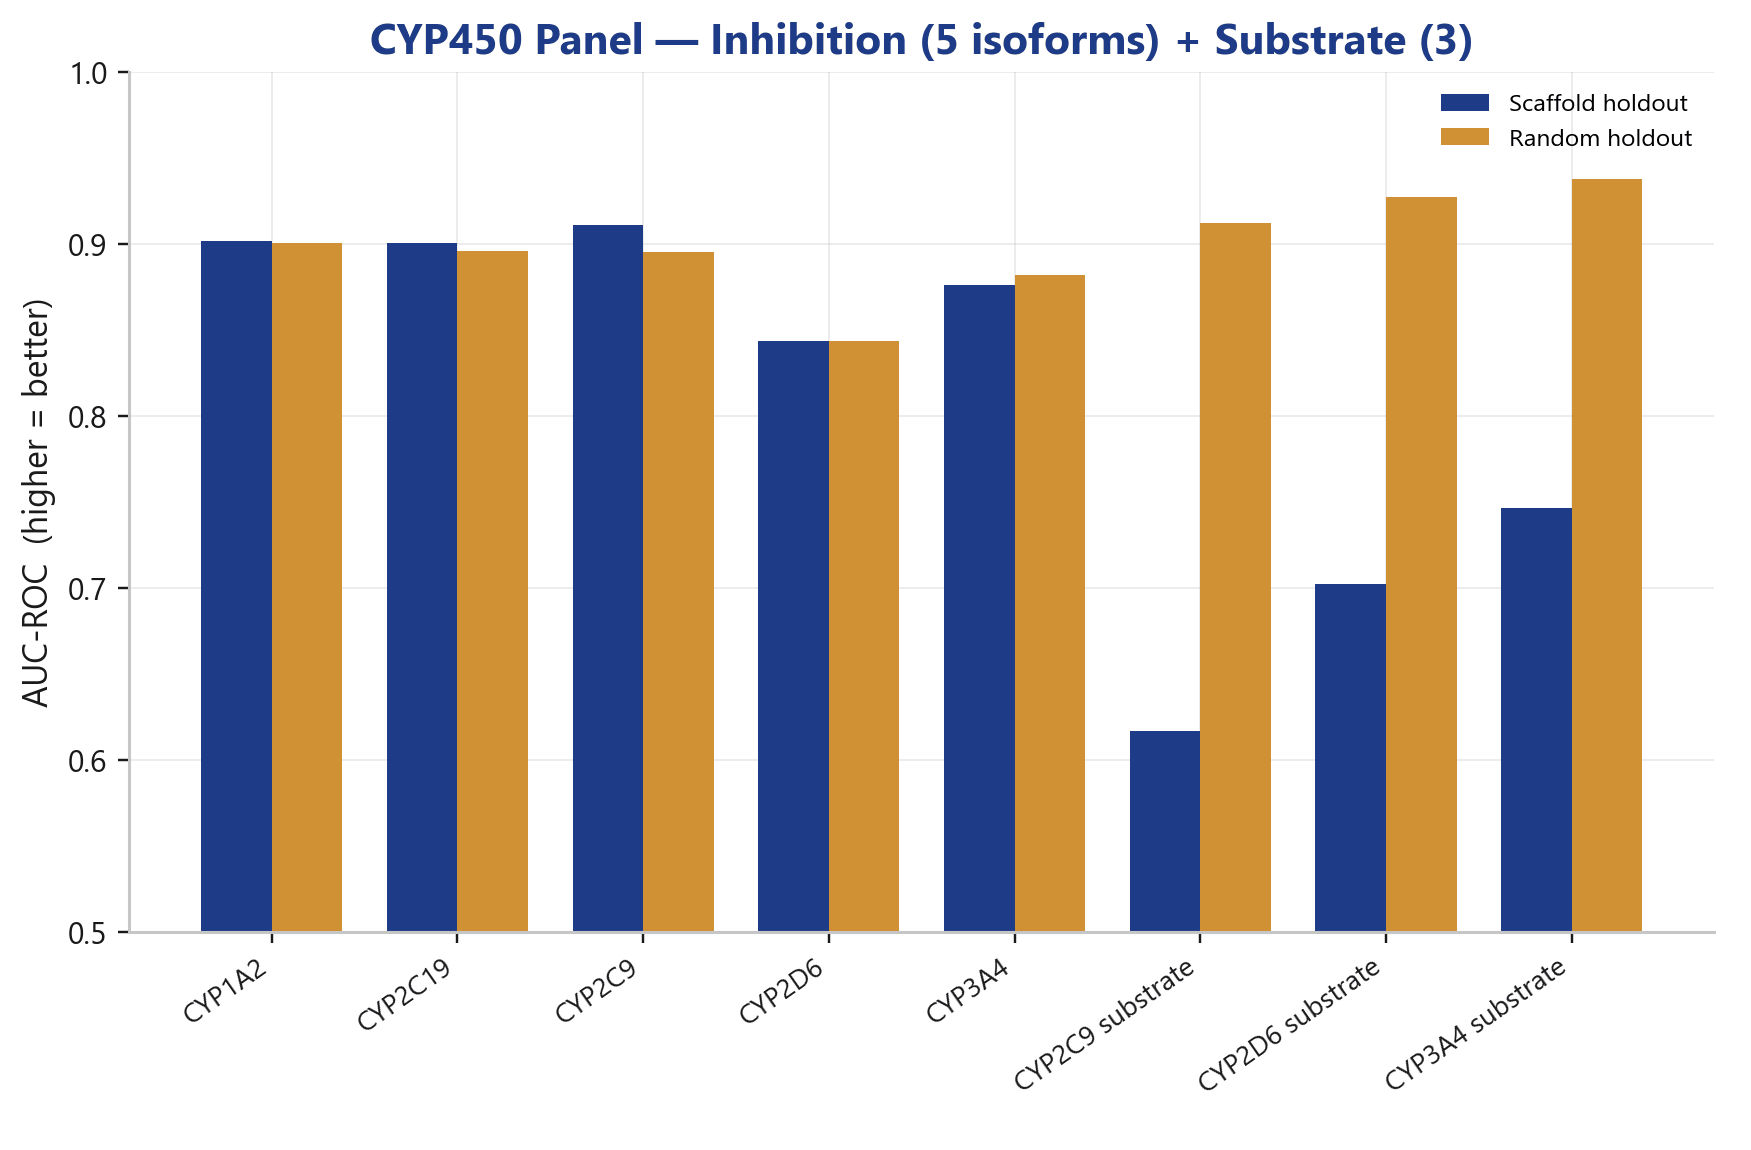
The CYP450 panel shows the expected pattern: the five inhibition isoforms are strong (CYP2C9 0.911, CYP1A2 0.902, CYP2C19 0.901), while substrate prediction, a generally hard task with little data, is weaker. This is consistent with the entire field and not a model-specific problem.
Honestly placed, and where it goes from here
We could have manufactured a "SOTA" headline out of this data by showing random-split numbers or cherry-picking the favourable endpoints. We deliberately do not. The state of things:
- Strong and deployable: broad ADMET / tox coverage, solid scaffold values on most classification endpoints, in one suite.
- Competitive: on the AUROC endpoints within a few points of the best specialized single models, with a generalist model.
- Not yet leading: the substrate endpoints, hERG and PPBR are open improvement targets for the next training cycle. We name them rather than hide them.
This openness is intentional. A verifiable, honest number is worth more in a regulated environment than an impressive one that falls apart with the first reviewer. The full endpoint scorecard with scaffold and random values sits at covasyn.com/benchmark.
See it for yourself
You get a safety profile for your own structure as a report: Tox21, CYP450, hERG, DILI and more, each with the holdout metric behind it. → See example evaluations
FAQ
Can toxicity be predicted?
For many endpoints yes, with good accuracy. Our toxicity model reaches a mean classification AUC of 0.860 across 42 ADMET / tox endpoints on the hard scaffold holdout; some (intestinal absorption, DILI, several Tox21 targets) are above 0.9. Others, like enzyme substrate prediction, remain hard for the whole field.
What is a good AUROC for toxicity prediction?
As a rule of thumb, an AUROC from ~0.85 is strong, from ~0.9 very good, provided it is measured on an honest split (scaffold holdout) and not an optimistic random split.
How does our toxicity model stack up against the TDC leaderboard?
In a true same-split, same-metric comparison our toxicity model sits on the AUROC endpoints on average a few points below the best dataset-specialized models, but reaches that with one pipeline across all 42 endpoints. Substrate endpoints and PPBR are open improvement targets.
What is the difference between scaffold and random split for tox prediction?
With a random split, test molecules resemble the training set, which overestimates accuracy. With a scaffold split, entire cores are held back: measuring real generalization to new chemistry. Our toxicity model reports the scaffold value.
Does our toxicity model cover ICH M7-relevant endpoints?
Yes, mutagenicity (Ames) is part of the suite and a central building block for impurity assessment. A dedicated use-case post follows.
Methodology and data
CovaSketch toxicity prediction, 42 endpoints. Headline split: scaffold holdout (novel molecular cores), random holdout as context. TDC head-to-head: official splits from the TDC ADMET Benchmark Group, 5 seeds, scored via group.evaluate; reference is the respective #1 leaderboard entry. Source: TDC ADMET Benchmark Group (tdcommons.ai/benchmark/admet_group, accessed 2026-05-23); Huang et al., Nat Chem Biol 18, 1033 (2022). Excluded: algae_ec50 (degenerate), clintox (untrained). Data snapshot: 2026-05-23.